Reading an Incident Report
The header chips name severity and the affected entity; the body lives in tabs (Report, Remaining Footholds, Remediations, AV Detections, Process Detections). Recommendation lives on the Report tab and is what you act on; Remediations is where you approve individual SOC-prescribed actions.
The Incident Report is the document you work from. Read it in the wrong order and you’ll spend twenty minutes reconstructing what the analyst documented in two paragraphs. Worse, you’ll act on the Evidence section instead of the Recommendation section, a misread the next lesson addresses head-on. The shape of the report is reliable across surfaces; learning it once pays off on every incident.
The shape on screen
An Incident Report has two regions: a fixed header strip at the top of the page (severity, status, host, organisation, plus the actions you can take on the whole incident), and a tabbed body below it. The Recommendation lives on the Report tab; individual SOC-prescribed remediation actions live on the Remediations tab; supporting context lives on the other tabs.
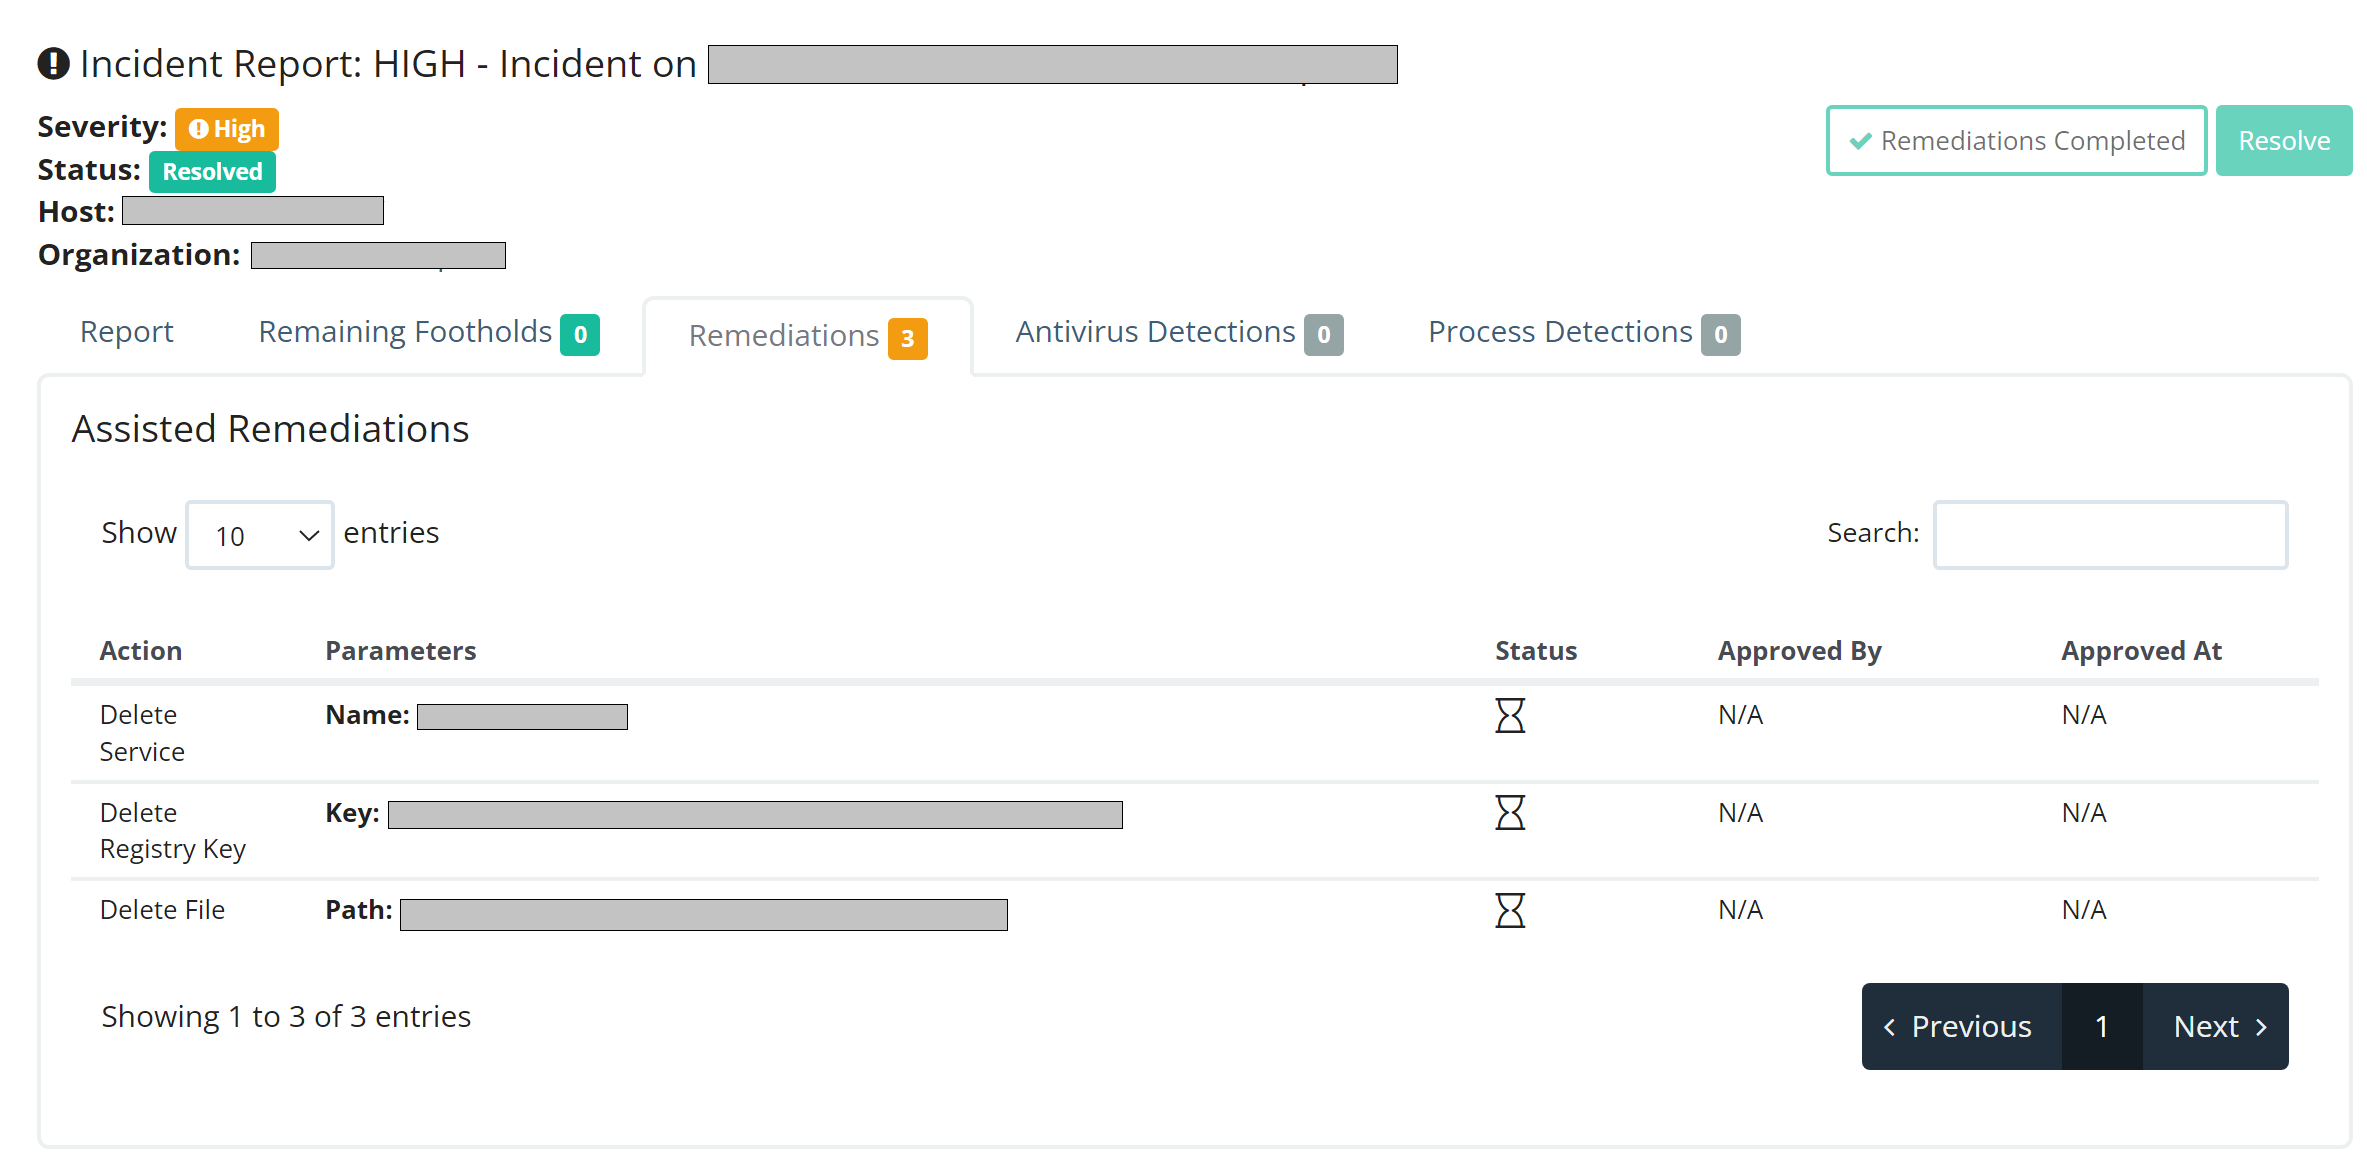
Severity (Low / High / Critical) tells you which playbook applies. Status (Open / Resolved / Pending) tells you whether anyone else has already moved on it. Read both before clicking anywhere else.
Confirm both before any destructive action. Two customers can have a host called SRV01; the Organization line is the disambiguator. The wrong-host problem is the sibling of the wrong-tenant problem from lesson 08.
The Summary, Evidence, and Recommendation prose all live on this tab. Open this first to find what the SOC wants you to do. Lesson 11 covers Recommendation vs. context in depth.
The table on this tab is the list of Assisted Remediations — specific actions (delete service, delete registry key, delete file) the SOC has lined up for you to approve. The Recommendation on the Report tab tells you to approve the remediations; this tab is where the clicking happens.
Visible top-right. Click only after the remediations are approved and the incident is genuinely worked. Course 8 covers the close-out comms that go with this click.
The header strip
The strip at the top of every Incident Report carries five load-bearing fields and two action buttons:
- Severity — Low, High, Critical chip. Lesson 09’s playbook routing happens here.
- Status — Open / Pending / Resolved chip. Tells you whether the incident is live, awaiting analyst input, or already closed.
- Host — the affected endpoint (for EDR) or the entity (a UPN for ITDR, a log source for SIEM, an EDR hostname with
Canaryin the title for canary trips). - Organization — the customer tenant. Always confirm before any destructive action.
- Report title — usually framed Incident Report: SEVERITY - Incident on HOST.
- Remediations Completed button — appears when all assisted remediations on the Remediations tab have been approved and run.
- Resolve button — closes the incident once you’ve actioned everything.
The tabs
Five tabs across the report body. Each surfaces a slice of the case:
- Report — Summary, Evidence, and Recommendation prose from the SOC analyst. This is where the action zone lives. Open this first.
- Remaining Footholds — anything persistent the SOC has flagged but not (yet) auto-remediated. Count in the tab badge tells you whether there’s work here.
- Remediations — the Assisted Remediations table; per-action approve clicks live here. The Recommendation on the Report tab points you here.
- Antivirus Detections — what the customer’s AV product caught alongside, for cross-reference.
- Process Detections — process-tree level evidence the agent collected.
The right reading order
Top-to-bottom on the tabs is the wrong order. The order below is what gets the Recommendation actioned cleanly without re-reading.
Header strip first
Severity, Status, Host, Organization. Five seconds. This tells you which playbook applies, whether the incident is still live, and which customer you’re about to touch.
Report tab — read the Recommendation
Skip past Summary and Evidence on the first pass. What does the SOC want done?
Verify the affected entity
The Host on the header strip — is it the one you’re looking at? Same Organization? The wrong-host check, the sibling of the wrong-tenant check from lesson 08.
Summary if the Recommendation surprised you
If the action is what you’d expect for this severity and surface, you can act. If it is not (Low severity but the Recommendation says isolate), read the Summary and Evidence on the Report tab to understand why before acting.
Remediations tab — approve the prescribed actions
Once you’ve internalised the Recommendation, switch to the Remediations tab and approve each row in the Assisted Remediations table. Status flips from hourglass to completed as each runs.
Resolve when done
Once Remediations Completed appears in the header strip and the incident is genuinely worked, click Resolve. Course 8 covers the close-out comms.
The reflex this lesson installs: Header first, Report tab next, verify entity, then Remediations tab to approve. New techs read top-down through the tabs in order (Report → Remaining Footholds → Remediations) and end up acting on the wrong section.
The Timeline view
ITDR Incident Reports, and a growing subset of EDR reports, include an Incident Report Timeline on the Report tab: a chronological reconstruction of the events that triggered the incident. For an identity compromise, the Timeline might show:
- Successful sign-in from new country, hour 0
- MFA method added, hour 0 plus 6 minutes
- Inbox rule created (forward all mail to external address), hour 0 plus 8 minutes
- Email sent to internal contacts, hour 0 plus 11 minutes
The Timeline is useful when you’re explaining the incident to a client (this is what happened, in order) and for verifying whether containment caught the activity in time. The Timeline is context, not the Recommendation. Reading the Timeline does not replace executing the Recommendation; it informs the conversation around the execution.
Building a counter-argument from the Timeline is second-guessing in slow motion.
What success looks like
- Given an anonymised Incident Report, you can point at the Recommendation section on the Report tab in under five seconds.
- You can state the affected Host and the Organization without re-scrolling — both live in the header strip.
- For an ITDR incident with a Timeline, you can walk a client through the sequence of events in order, without re-reading the Timeline twice.
- You know when the Remediations Completed indicator appears (after every row on the Remediations tab is approved and run) and when Resolve becomes the right click.
A worked report
An EDR Incident Report lands. Header strip: severity High, status Open, host SRV-FILE02, organization Contoso. The Report tab’s Summary says scheduled task running encoded PowerShell discovered. Evidence shows the full command line and the decoded payload (downloads and runs a script from a known-bad domain). Recommendation: approve the scheduled-task remediation; isolation not required at this time.
Right move: header strip first (High, Open, SRV-FILE02, Contoso) — confirms you’re looking at the right host on the right customer. Report tab next — read the Recommendation. Skip Summary and Evidence on the first pass; the Recommendation is approve the scheduled-task remediation. Switch to Remediations tab. Approve each row in the Assisted Remediations table. Once Remediations Completed appears in the header, Resolve.
Reading the Evidence on the Report tab to re-decide whether the analyst got it right is the cardinal mistake. The Recommendation is the action; everything else is context.