Reporting at scale. Insights, AppAware, and the Data Export add-on
Cut DNSFilter's reporting surface into three audiences (IT lead, exec, MSP team), then pick the right surface. Insights, AppAware, or Data Export, for each.
DNSFilter exposes several reporting surfaces, the Overview dashboard, Reporting → Insights, AppAware Reporting, and the Data Export add-on. Each one is the right answer for a different audience. Picking by audience first, surface second, prevents the trap of dumping a 40-page PDF on someone who needed three numbers. Remember the data shape: DNSFilter shows DNS-layer activity only, no endpoint events, no SaaS activity, no email content. Customers who need “everything” need to layer DNSFilter into a broader observability stack.
The three audiences
| Audience | Question they’re answering | Cadence | Right surface |
|---|---|---|---|
| Customer’s IT lead | ”Are we blocking what we should? Who’s pushing on what?” | Weekly to monthly | Reporting → Insights, filtered to the sub-org |
| Customer’s executive | ”Is this service worth the line item?” | Quarterly | Custom executive summary built from Insights highlights |
| MSP team | ”Where are we spending support hours? Which customers are noisy? What’s our overall blocking quality?” | Weekly internal | Cross-sub-org aggregation via Data Export + your own dashboarding |
What each surface gives you
The four surfaces aren’t a pipeline; they’re four answers to four different questions. Pick by audience and question, not by walking a chain.
The Reporting tab houses Insights and AppAware Reporting. Overview is reached via the dashboard home, Data Export via Tools.
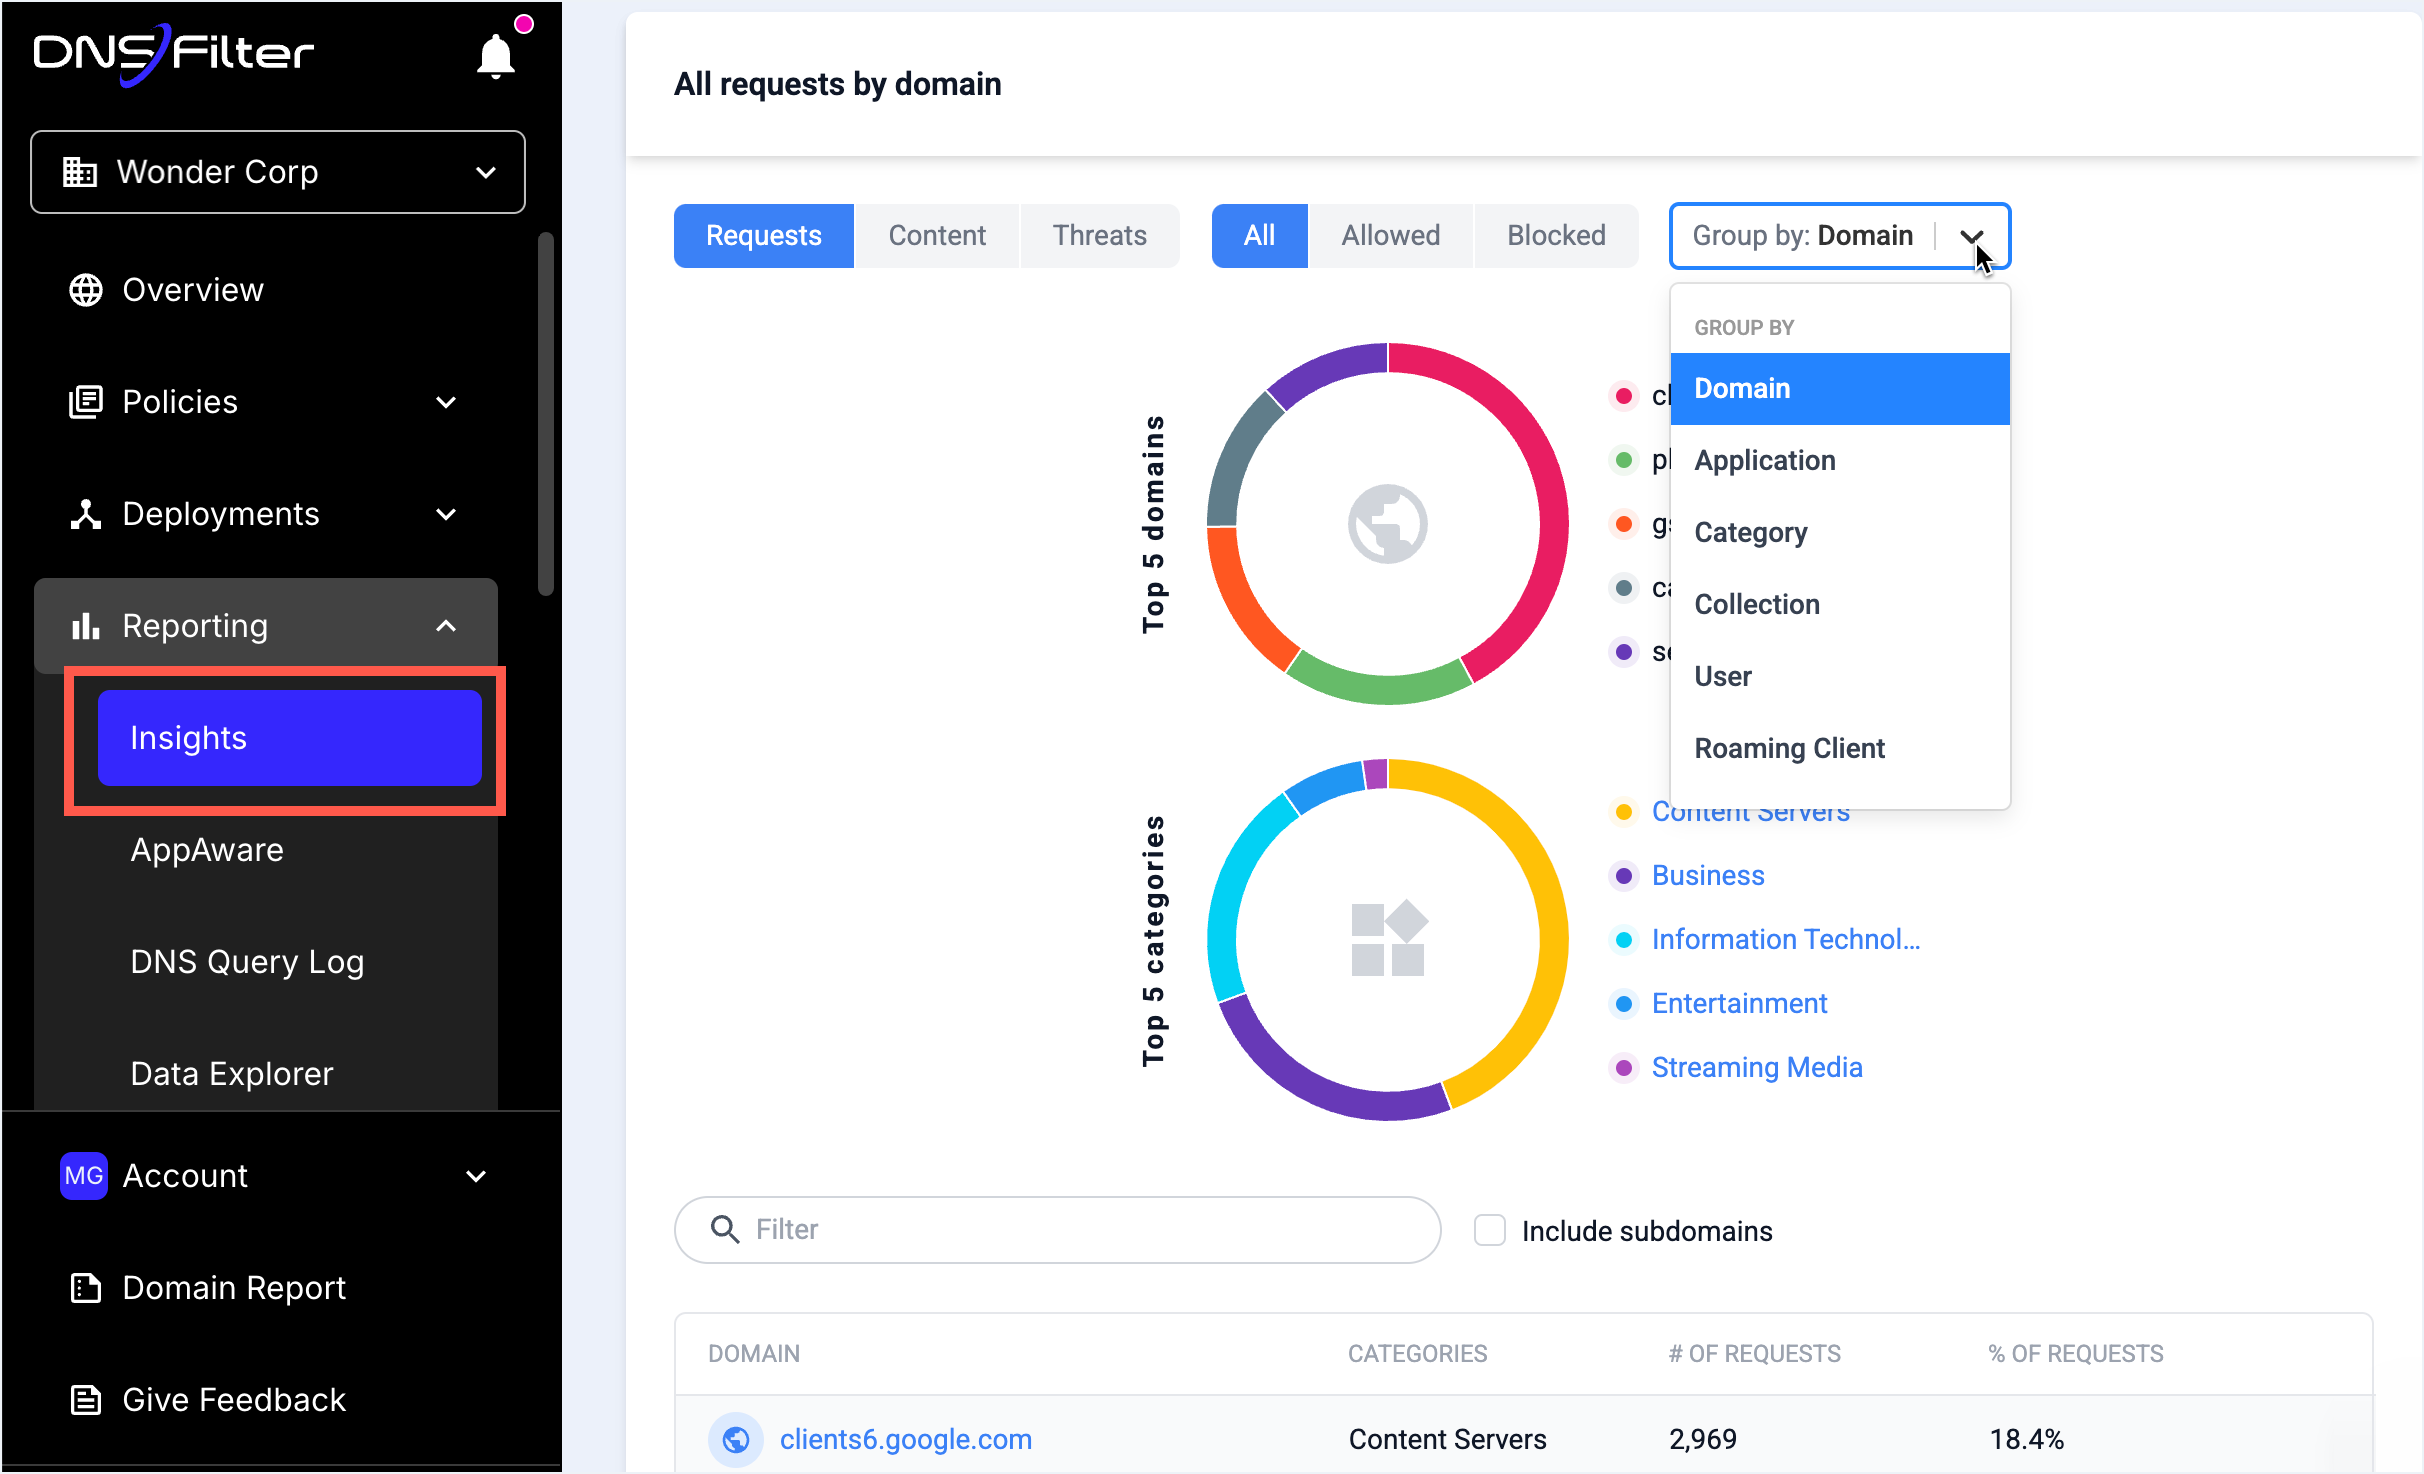
Customer-facing reports start here. Filter to the sub-org and date window before grouping.
Group by Domain for “what got blocked”, by User for “who pushed on what”, by Collection for IdP-group-shaped reporting.
Use PDF for the quarterly review attachment, CSV when you need to merge with other data.
Weekly cadence for IT leads, quarterly for executives. The Insights retention window scales with plan; check the in-product limit before quoting it.
Overview
The default landing page. Account-wide activity over the last 7 days, suitable for a NOC display or a quick “is anything weird right now” glance. Not for sit-down reporting, the time window and aggregation aren’t tunable enough.
Insights
Reporting tab → Insights. Filterable by date range and report-specific drill-down: Allowed, Blocked, Organization, Users, or Roaming Clients. This is your weekly customer-facing report source. Filter to the sub-org, pick the report, export the page as PDF or CSV, attach to the customer’s PSA ticket.
Insights retention scales with plan and is materially longer than the Query Log’s. The exact retention window changes as DNSFilter tunes plan limits, so confirm against the Reporting plan-limits article before quoting a number to a customer. The 30-, 60-, and 90-day tiers some MSPs cite belong to the AppAware Reporting product, not Insights as a whole. For any report covering more than a couple of weeks, you’re working in Insights, not the Query Log directly.
AppAware Reporting
DNSFilter’s view of app usage by mapping domain activity to known applications. This surfaces “shadow IT”, sanctioned apps used outside the sanctioned plan, unsanctioned apps in use without IT visibility. Best used as the anomaly report: don’t dump every app, surface the ones the customer didn’t expect. AppAware’s own data retention runs on the 30 / 60 / 90-day plan ladder.
Data Export add-on
The paid add-on that unlocks higher export limits and scheduled, automated extraction. This is the right path when:
- The customer wants their DNS data in their own SIEM. Data Export integrates directly with most SIEMs.
- The MSP wants cross-sub-org aggregation. Data Export from each sub-org into a central data lake gives you the dashboards the in-product Insights view doesn’t.
- The customer’s compliance regime requires longer retention than DNSFilter’s native Query Log (capped at around 9 days, plan-dependent) or Insights (longer, plan-dependent, confirm in-product before quoting).
The executive summary template
Quarterly review for a customer. One slide, five points:
- Threats blocked this quarter, total, plus the breakdown into Phishing / Malware / Botnet / Cryptomining.
- The top three most-blocked domains, with a one-line “this is what it is” caption per row. (Make this human; “various ad networks” beats a list of
tracker.example.example.) - Top three users by blocked-traffic volume, anonymised if the customer’s HR posture requires it.
- One operational success story, “We caught X phishing attempt against the finance team on date Y; it was blocked before any user could click.”
- One asks-of-customer, “Your developers are increasingly hitting
pypi.examplefor package downloads; we’d like to confirm that pattern fits your security posture.”
The asks-of-customer point is what differentiates a useful executive review from a wall of numbers, it gives the customer a reason to engage, and you a reason to keep their feedback fresh.
Cross-sub-org aggregation: the MSP-wide view
This is what DNSFilter doesn’t give you out of the box, and what the Data Export add-on enables you to build:
| Question | Path |
|---|---|
| ”Which of our customers got hit hardest by the campaign that started last week?” | Data Export from all sub-orgs → BigQuery / Splunk / etc. → query joining campaign indicators against per-customer block volumes. |
| ”Across our book, how many users hit Phishing blocks this month?” | Same path. Reports out of one customer at a time can’t sum. |
| ”Which sub-orgs have noisy block patterns we should investigate?” | Aggregate, percentile per customer, identify outliers, dig into the sub-org’s Insights. |
The MSP API (covered in lesson 4) is the alternative path for ad-hoc cross-sub-org queries. Data Export is the better choice when you want recurring, scheduled aggregation.