Portal walkthrough — the global view (Command Center)
The Command Center is the dashboard you land on. Active issues for at-a-glance severity, Open Escalations for things needing your eyes, Triage Feed for chronology, and the top nav for drilling into Incidents, Organizations, and the rest.
You don’t need to memorise the Command Center. Huntress changes it every few months and lessons would go stale fast. You do need to know which parts of it carry the load on a shift — the strip that tells you what’s hot, the panel that says you’re behind, and the feed that lets you catch up after time off. This is the orientation pass, not the deep dive.
Two contexts in the portal
Two contexts matter: global and organisation-scoped. Global is the Command Center, what you see when you log in: every organisation you have access to rolled up, every Critical and High across them, the recent SOC activity in one feed. Organisation-scoped is what you see when you’ve clicked into a single customer; same surfaces, narrowed to that one tenant. This lesson is the global view. The next lesson is inside an organisation.
What the Command Center actually shows
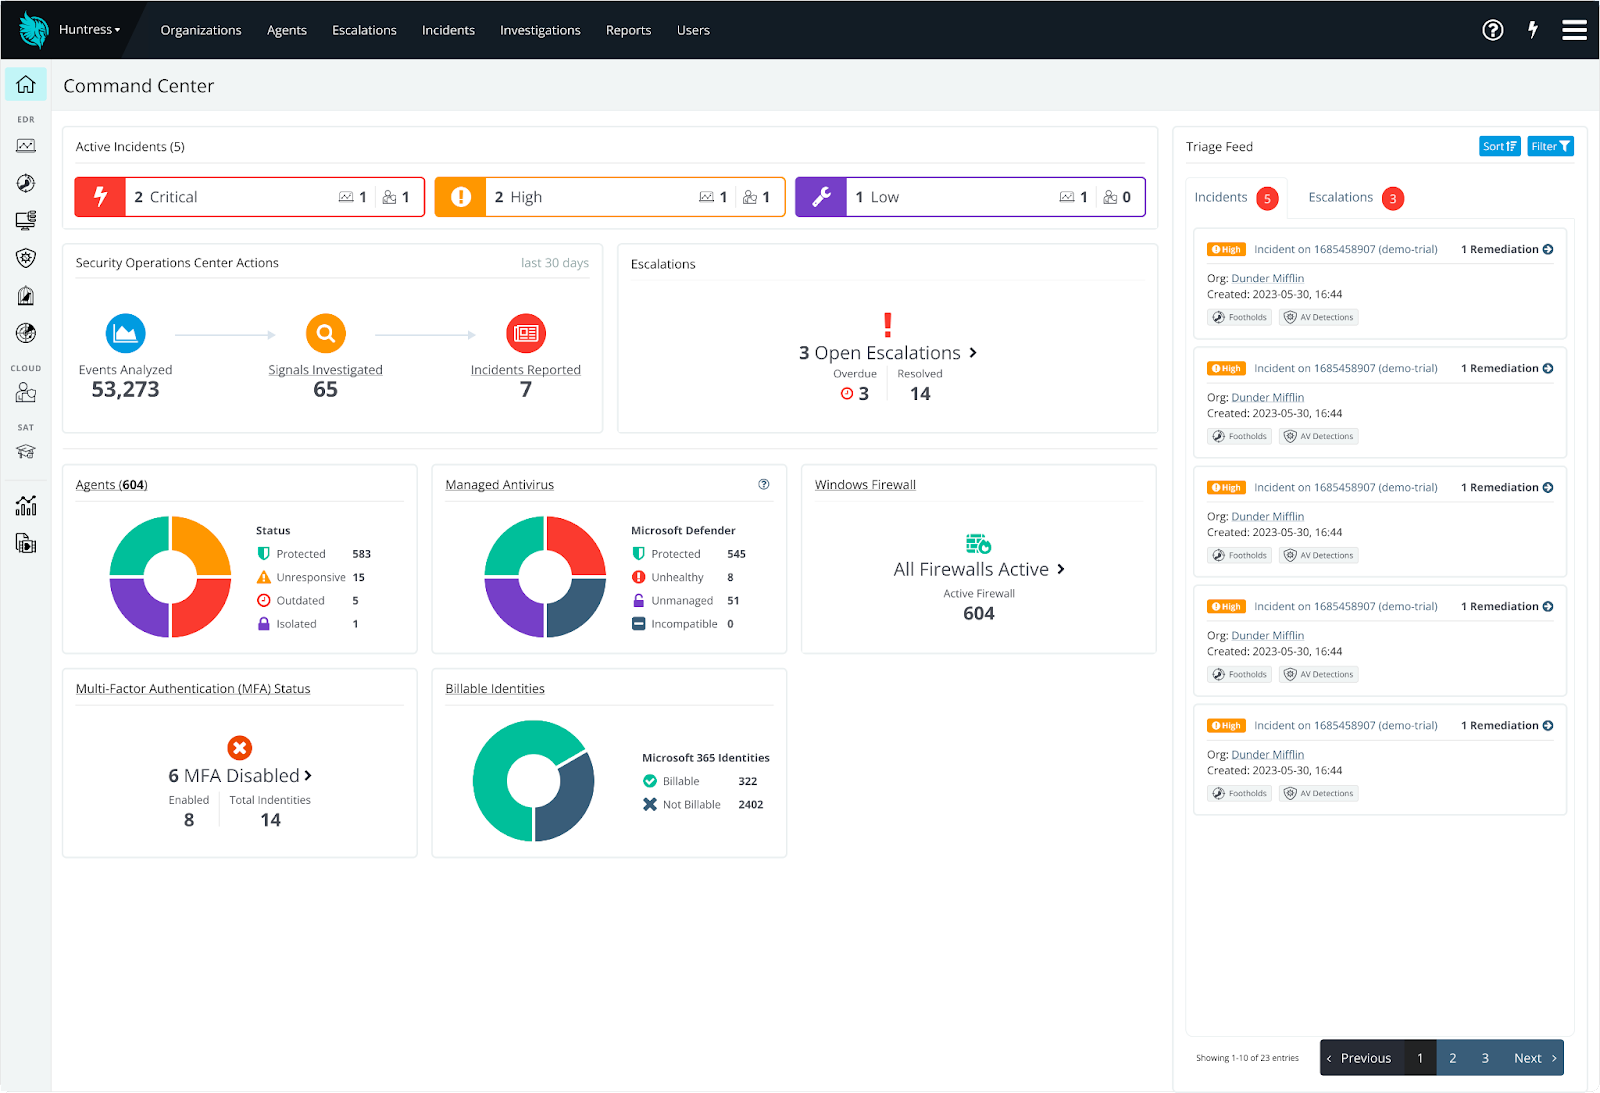
The first thing to read on a shift. Critical, High, Low chips show open counts across your whole book. Use it to pick where to start before drilling into the Incidents page.
Events monitored, signals investigated, incidents reported. Useful for client-quarterly framing more than day-to-day work; quietly answers what is Huntress doing for me.
Higher signal than the Incidents list because the SOC has named them. Treat the number as a queue you owe a response on; clicking through gets you the per-escalation context.
Right rail. Useful when you’ve been off for a few days and want to scan what happened in order. Not where you decide what to work; that’s Active issues plus the Incidents page.
The horizontal bar at the top is how you leave the dashboard. Incidents is the filtered cross-surface list you actually work from; Organizations is the per-customer switch. Identity and SIEM surfaces appear inside an organisation, not at this level.
Reading the dashboard in shift-start order
The Command Center is laid out for a scan, not a deep read. The order to read it is:
- Active issues (top-left strip): the severity shape of the day. One Critical, two High, one Low means you have one thing to drop everything for and two for the morning block.
- Open Escalations (centre): work the SOC pushed at you specifically. Higher signal than a fresh Incident — someone analysed it and called it out.
- Triage Feed (right rail): chronology check. After a weekend or a day off, this is where you catch up.
- Top nav → Incidents: when you’ve decided what to work, you click into the Incidents page to filter and act.
The mistake to avoid is clicking straight into Organizations and walking customer by customer. With more than a handful of tenants you spend an hour discovering nothing changed. The Command Center is laid out so the change finds you, not the other way around.
The two-filter habit on the Incidents page
When you drill into Incidents from the top nav, the page accepts severity and status filters independently. They have to be combined.
What the dashboard does NOT do
- It does not replace the Incidents page for actually working tickets. The Command Center is for orientation; you action from Incidents.
- It does not show per-customer detail. For that you switch into the organisation (next lesson).
- It does not surface Identity or SIEM as top-level items at this level. Those live inside an organisation; the global view aggregates incidents from them but does not navigate to them directly.
When the answer is “escalate”
One case warrants flagging: you can’t see something you expect to see. A whole organisation that isn’t there. The Open Escalations card showing zero when a senior just told you they pushed two to you. The Triage Feed missing items you know happened. That is a permissions or licensing question, not a tech question. Surface it to a senior to resolve, don’t work around it.
The case it does not cover: you clicked the wrong card or filtered the page poorly. That’s a quiet self-correction. Acting on the wrong customer is the escalation case, and the next lesson is built around preventing it.
A worked catch-up
You log in. You haven’t been at work for three days; you covered a weekend off. The right move is read the dashboard, then click into Incidents. Active issues tells you the shape of the day: one Critical, three High, several Low. The Triage Feed on the right tells you whether anything dramatic happened over the weekend (a cluster of red entries means yes). Open Escalations tells you what the SOC has put at your feet.
A pattern to spot: Active issues shows “1 Critical” and the Triage Feed has three entries for the same organisation in the last hour. That cluster is itself a signal — three Criticals on one tenant is tell the senior territory before you’re hours into the response. You don’t pause to escalate, you contain and you flag.