Reporting and cost control
The Printix Dashboard for high-level usage, the Power BI report for cost allocation by user / department / printer, and the analytics setup needed before any of it works.
Customers buy Printix to retire a print server, but they keep paying for it because of what’s measurable now that wasn’t before. Pages per user. Cost per department. Save-O-Meter (uncollected jobs). The Beginner course showed the Dashboard counters; this lesson is the operational design behind reporting that survives quarterly reviews.
The two reporting surfaces
flowchart LR
    A[Printix tenant<br/>print activity] --> AC{Analytics<br/>configured?}
    AC -->|Yes| ANL[Settings, Analytics tab<br/>data extracts to Power BI]
    AC -->|No| D[Administrator Dashboard only<br/>Last 7/14/28 days,<br/>summary counters]
    ANL --> PBI[Printix Power BI report<br/>Users, Printers, Cost,<br/>Tree-O-Meter, Service Desk]
    D --> Q[Quick-glance only,<br/>no per-user drill-down]
The two surfaces serve different audiences:
- The Administrator Dashboard. Built into Printix Home. Needs no setup. Shows period counters: Print activity (pages over the period), Save-O-Meter (uncollected percentage, indicating secure-print effectiveness), Printed in black (mono ratio), Printed 2-sided (duplex ratio), Secure print (ratio of pages released through Printix App). Period selector: Last 7 days, Last 14 days, Last 4 weeks. Good for “is the tenant healthy?”; not enough for billing or cost-per-department.
- The Printix Power BI report. Vendor-supplied template for Power BI Desktop. Needs analytics enabled (Settings, Analytics tab) so Printix exports the data the template consumes. Multiple pages including Users - Overview, Printer - History, Cost, Tree-O-Meter, and Service Desk. (Tree-O-Meter shows trees-saved by 2-sided plus uncollected pages, using a Sheets Per Tree conversion.) This is where per-user, per-department, per-printer numbers live.
Setting up reporting, in order
Three steps. Skip one and the rest don’t work:
| Step | Where | What it does |
|---|---|---|
| 1. Enable Analytics | Settings, Analytics tab | Turns on the data extract Printix needs |
| 2. Set up Power BI | Power BI Desktop, open the Printix solution template | Connects the template to the customer’s analytics extract |
| 3. Optionally, publish to Power BI Service | The Power BI service in M365 | Lets the customer view the report on the web with a Power BI Pro licence |
Power BI Pro is required to publish to the web. Power BI Desktop alone (free download) is enough to use the report on a single workstation.
What the cost calculation actually does
The Power BI template doesn’t read meter prices from your printer fleet. The administrator enters cost variables once when setting up the report. Those variables are the parameters the template’s cost-per-page maths runs on:
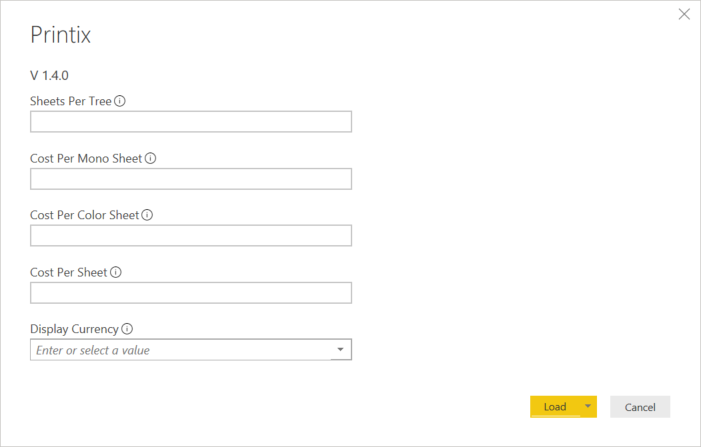
| Variable | Meaning |
|---|---|
| Sheets Per Tree | Trees-saved equivalent for the Tree-O-Meter |
| Cost Per Mono Sheet | Toner cost for a black-and-white page |
| Cost Per Color Sheet | Toner cost for a colour page |
| Cost Per Sheet | Paper cost per sheet |
| Display Currency | What every cost column is rendered in |
The Printix doc is honest about the model: “it is not possible to accurately calculate the total cost of the printer environment, we can estimate the cost based on what is being printed through Printix.” That’s exactly what the report does. Pages printed times the per-page costs, with duplex factored in (one sheet for two pages). The output is a credible estimate, not a finance-grade ledger. Use it for trend-watching and chargeback, not for tax reporting.
A worked rollout: Able Moose mid-market chargeback
Able Moose’s CFO wants a quarterly chargeback model: each cost-centre (Audit, Tax, Advisory) pays for its own printing. Plan:
Enable analytics
System manager opens Settings, Analytics tab, enables analytics.
Group users by cost-centre in Microsoft Entra
Three groups: “Printix-Costcentre-Audit”, “Printix-Costcentre-Tax”, “Printix-Costcentre-Advisory”. Each user is in exactly one. (These are reporting groups, separate from the access groups from the previous lesson; named differently to avoid drift.)
Open the Printix Power BI template
Open in Power BI Desktop, connect to the analytics export, set Cost Per Mono Sheet ($0.05), Cost Per Color Sheet ($0.20), Sheets Per Tree (8333), currency AUD.
Use Users - Overview filtered by group
The Users page lets the CFO filter by Microsoft Entra group. Audit’s totals, Tax’s totals, Advisory’s totals; the Cost page sums.
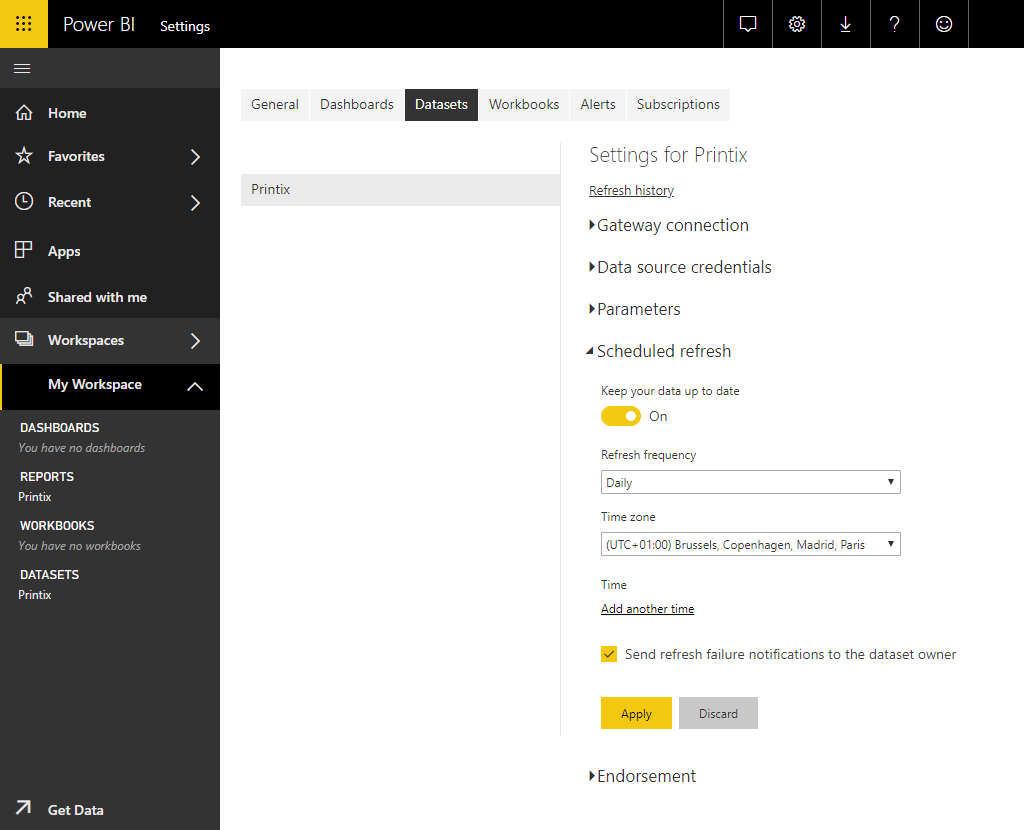
Schedule quarterly export
Power BI’s quarterly schedule emails the CFO. Schedule the dataset refresh (and the email subscription) from the Power BI service; the MSP isn’t in the loop unless something breaks.
The pattern: groups in Microsoft Entra do double duty for both access (previous lesson) and reporting (this lesson), but they’re separate group sets so a name change for one doesn’t break the other.
What this is NOT
- Not real-time monitoring. Both surfaces (Administrator Dashboard and Power BI report) lag actual print activity. The Dashboard updates when reloaded; Power BI on a schedule. Don’t promise the customer minute-by-minute alerts; that’s a webhooks scenario in the Advanced course.
- Not a security audit log. Printix has a History tab on printers, computers, and groups for operational audit. Compliance-grade audit logging is the customer’s IdP and SIEM, not Printix’s reporting surface.